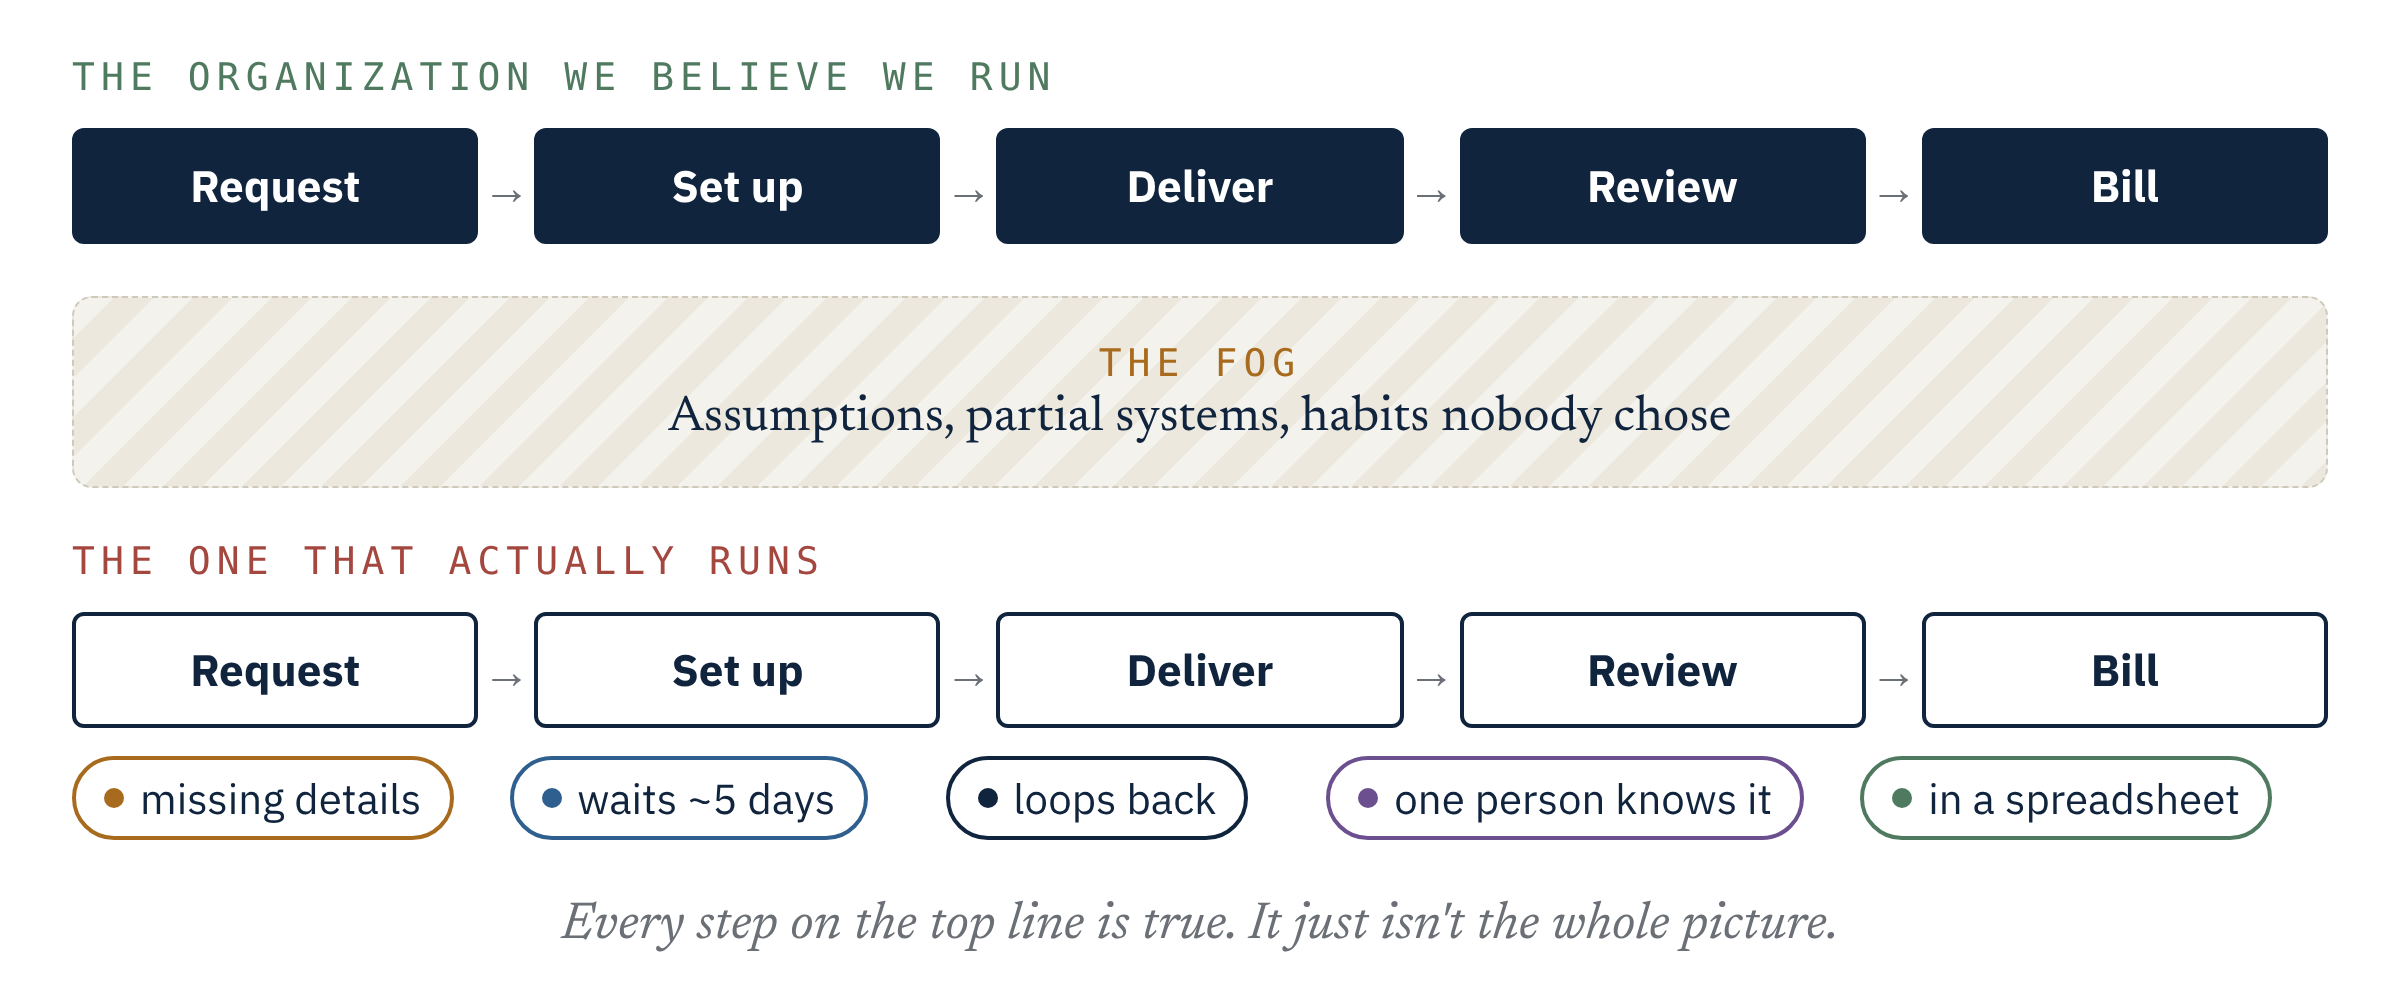
An organization chart answers one question well: who reports to whom. It's a poor guide to the questions that drive most results: how work actually moves, where it waits, and who decides when it crosses a boundary.
That isn't a criticism of org charts. Every business needs one. Structure is how accountability, budgets and careers get managed. The fog comes from treating the chart as if it were the operating model, as though drawing the boxes well means the work between them will take care of itself.
Work moves sideways
Pick almost any outcome a customer would recognize: an account opened, a claim paid, an order shipped, a client onboarded. On its way to completion it crosses several functions. Sales, operations, compliance, finance and technology each touch it. Each manages its own part, often very well. Nobody manages the whole trip.
So the constraints that matter most tend to sit at the crossings. A handoff where work waits for someone to notice it. A status that has to be chased by email because two systems don't share it. An approval that sits with one person. A decision that belongs to two teams and so, in practice, to neither. None of these show up on the chart, and each function's own metrics usually look fine.
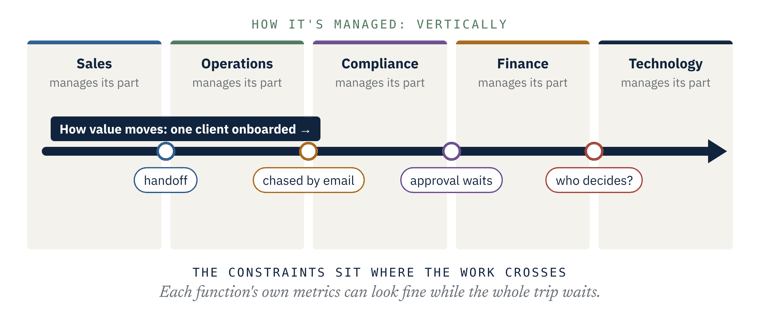
None of these crossings appears on the org chart.
When the chart becomes the plan
This matters most when the structure is about to change. In a large insurance integration where I led the claims side, the natural plan was to bring two claims organizations onto one chart: same titles, same workflows, same dashboards. One side ran a staffing ratio about six times the other's. On the chart, that looked like inefficiency, and the obvious fix was to average them.
Following the work told a different story. Each organization had been built on different assumptions about the volume and complexity of its claims, and the work itself ranged from genuinely simple to genuinely complex. Merging the charts would have served neither. What worked was sorting the work by complexity as it came in and sizing the teams to it. The staffing gap went from about 6:1 to about 1.5:1, by matching work to capability rather than averaging headcount.
The chart wasn't wrong. It just couldn't see the work.
The discipline
The discipline is to look at the business the way the work moves, then let structure follow:
- Map the flow, not the functions. Follow one outcome from start to finish and record every step, handoff and wait, whichever team it belongs to.
- Look through more than one lens at once. I use five: process, data, systems, people and culture. A constraint that sits where two of them meet, such as a manual workaround that exists because a system can't hold a piece of data, is invisible to anyone looking through only one.
- Name the joins. For each crossing that matters, ask who owns it. If the honest answer is "both" or "nobody," that's usually where the time and money go.
- Design structure last. Once you can see how work flows and where it binds, decisions about teams, roles and reporting lines get much easier to make and to defend.
A test for this week
Choose one outcome your customers care about and walk it end to end. Count the handoffs, the waits and the times the same data is entered again. Then ask one question in your next leadership meeting: who owns the whole trip? If the room goes quiet, you've found the fog.
Lessons from the Fog is a series on where capable organizations lose sight of how they really work, and the disciplines that bring it back into view. Previous lesson: The most expensive thing in business might be what you think you know.
A 30-minute conversation about the decision ahead, whether it fits, and what a first cycle would cover.
Talk to us