
Revenue & Retention Diagnostic
CRO · CCO · CFO — a pattern in pipeline or retention you can't structurally explain.
The metric is moving in a way the dashboards can describe but can't explain.
A falling NRR, a declining win rate, an expansion stall, a churn spike, a CAC inflation, a pipeline deterioration. The CRO is the revenue architect; the CCO is the customer-side architect; the CFO is the third leg because revenue and retention patterns translate directly to financial outcomes. The pipeline exists. Stage progression exists. Every function has a theory about why the metric is moving — none of which reconcile. The standard analytics show what is happening; they do not surface the structural cause.
Unlike a board cycle or an exit window, this moment compounds continuously. Every quarter the pattern persists, the financial impact grows and the capability gap widens. The diagnostic-to-action speed determines how much damage is done before the correction takes hold. And functional credibility is on the line: patterns that surface and persist without the CRO or CCO offering structural explanation produce executive-replacement risk; patterns that get explained with capability-grounded analysis preserve functional authority and allow the responsible leader to lead the correction.
Two patterns that send corrective investment to the wrong function.
Revenue and retention patterns have many possible causes — sales-execution capability, pricing capability, product-fit, customer-success execution, market dynamics, competitive pressure, macro pressure. Choosing the wrong cause to address produces visible activity without measurable result. The two patterns below are the most consistent ways the diagnostic goes wrong.
Both patterns reflect the same misread: that the function feeling the pain is the function carrying the cause. The diagnostic work decomposes the pattern beyond the headline metric — funnel stage, cohort vintage, segment-mix — and traces it to the capability constraint that's actually generating it. The work is cross-functional by design, because the causes are.
A causal explanation of the revenue pattern that all functions can stand behind.
Zero Fog runs the SEI substrate across the revenue and customer layers, decomposes the pattern beyond the headline metric, and returns the structural read the CRO or CCO walks into the next QBR with. What the pattern actually is, decomposed by funnel and cohort. Where in the architecture it originates. Which capability constraint is generating it. What intervention addresses the cause rather than the symptom — and which function actually has to lead the correction.
- Pattern decomposed beyond the headline — funnel stage, cohort vintage, segment-mix, vintage effects surfaced separately
- Capability constraint named at the layer it sits, with capability root identified
- Cross-functional misdiagnosis tested explicitly — surfaces patterns surface in revenue but originate in service, or surface in retention but originate in pricing
- Causality classification on every linkage; fog-qualified confidence on every finding
- Intervention targeting the cause, not the symptom — with the function that has to lead the correction named explicitly
- Defensible under operating-cadence scrutiny — the CEO, CFO, and other executive-team members who will read the diagnostic
Engagement Shape
Best entry: Execution Diagnostic, scoped to the specific revenue or retention pattern surfacing in the current operating cadence.
Common follow-on: Quarterly Execution Cycle on the binding capability constraint, run cross-functionally where the constraint sits across functional boundaries.
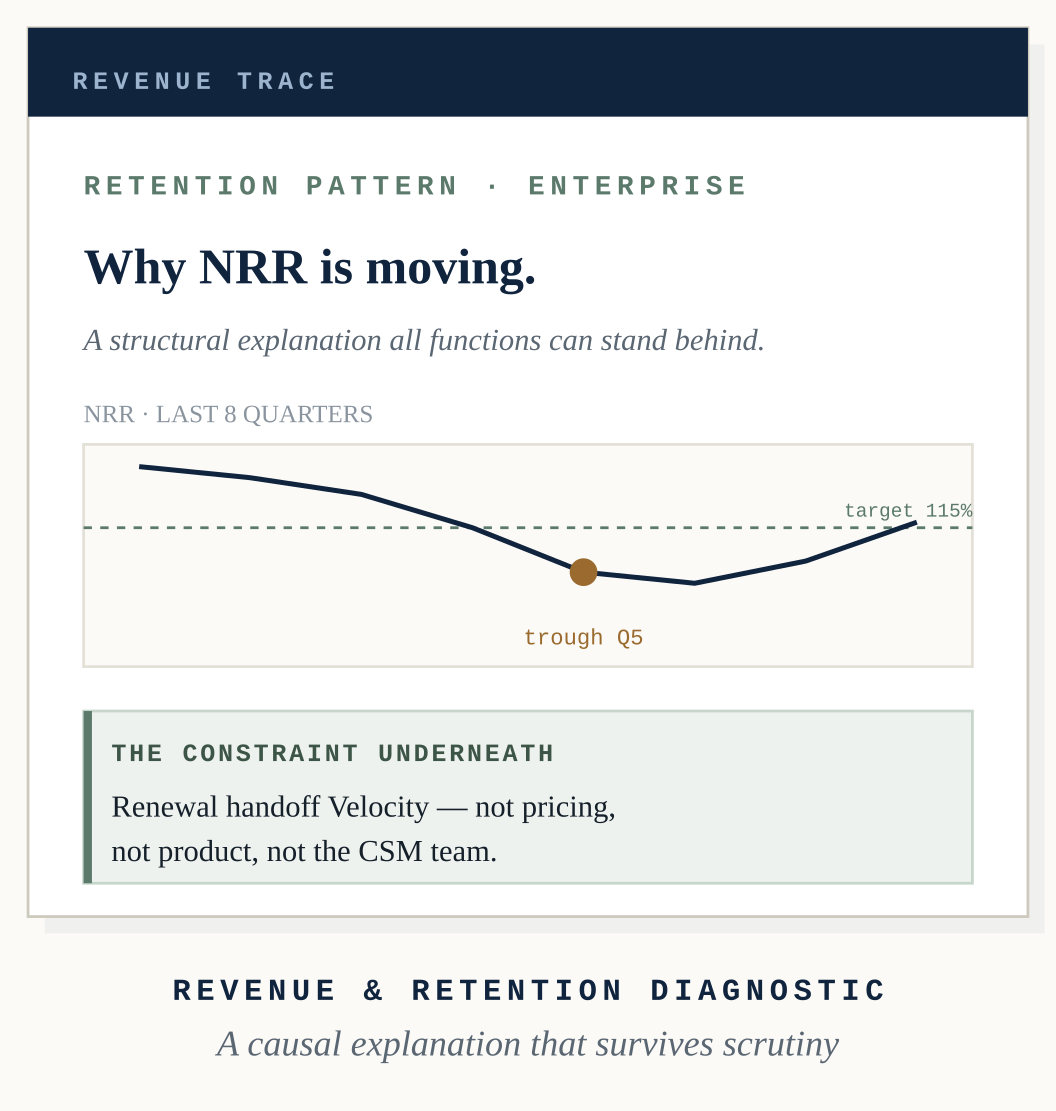
Anchor artifact: Revenue Trace — a structural explanation of the pattern with the constraint underneath named explicitly. The deliverable shown above.
Typical timeline: 30–45 days for the diagnostic; renewable 90-day cycles thereafter, aligned to the QBR cadence.
Two ways forward.
Thirty minutes with the founder to discuss your revenue or retention pattern directly. Senior practitioner on the call. No deck. The primary path for CROs and CCOs ready to decompose a pattern.
Request fit call →A self-guided session with our analytical substrate running on your company's profile, with the situational diagnosis matched to Revenue & Retention Pattern. The path for prospects who want to experience the substrate before committing to a conversation.
Access the experience →Revenue and retention patterns frequently surface alongside one of these: